1. 问题起因
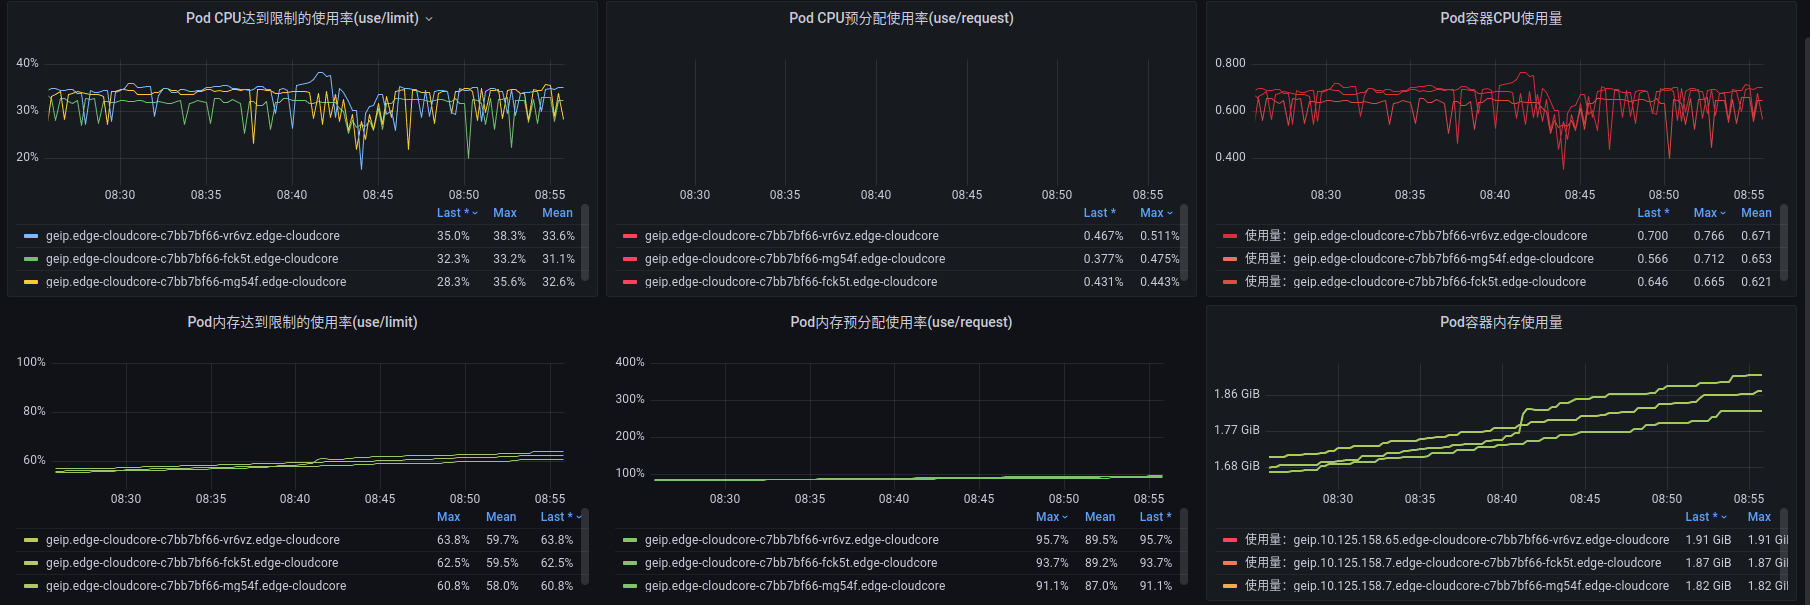
通过查看 cloudcore 监控,发现内存在缓慢增长:
因之前在 cloudcore 中加过pprof
1
2
3
4
5
6
| "net/http"
_ "net/http/pprof"
go func() {
klog.Errorln(http.ListenAndServe(":6080", nil))
}()
|
因此打开/debug/pprof/,经过一段时间的间隔观察,发现 goroutine数量在稳定的缓慢增长,确定有点像 goroutine 泄漏(阻塞),
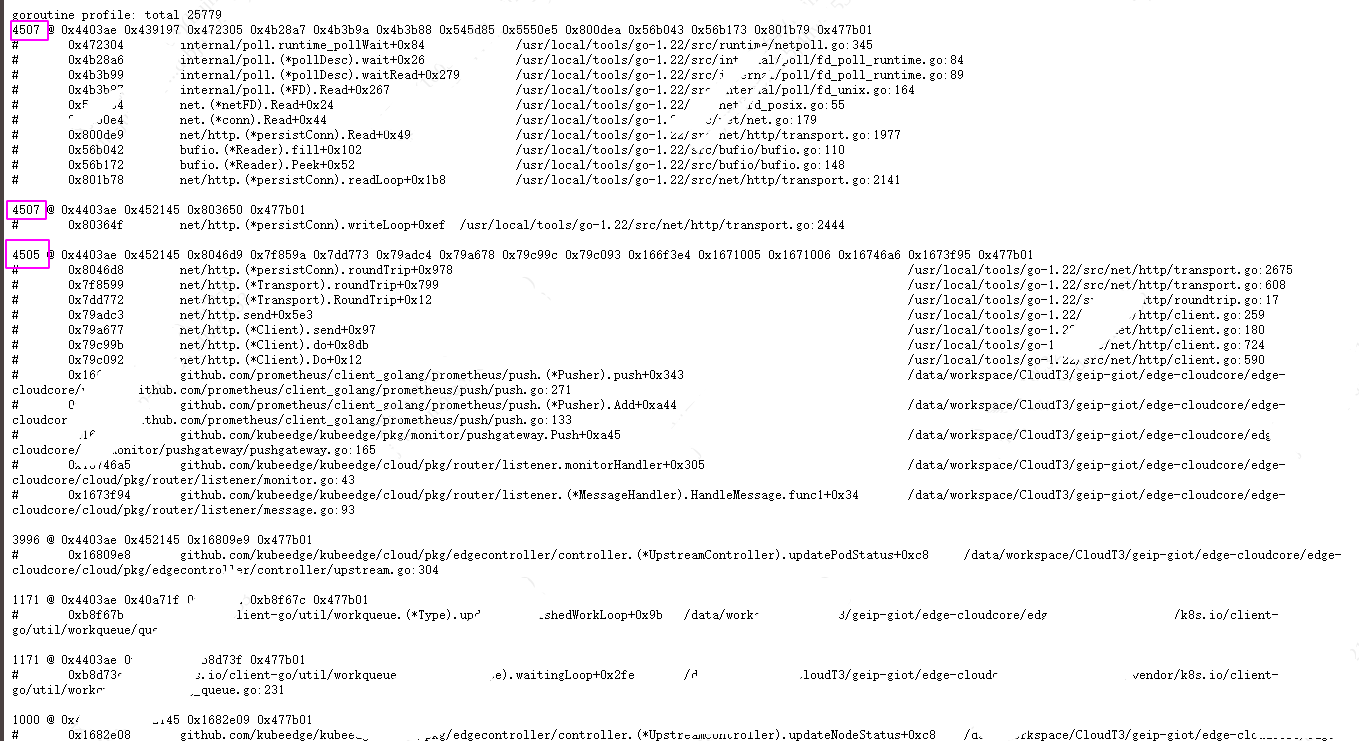
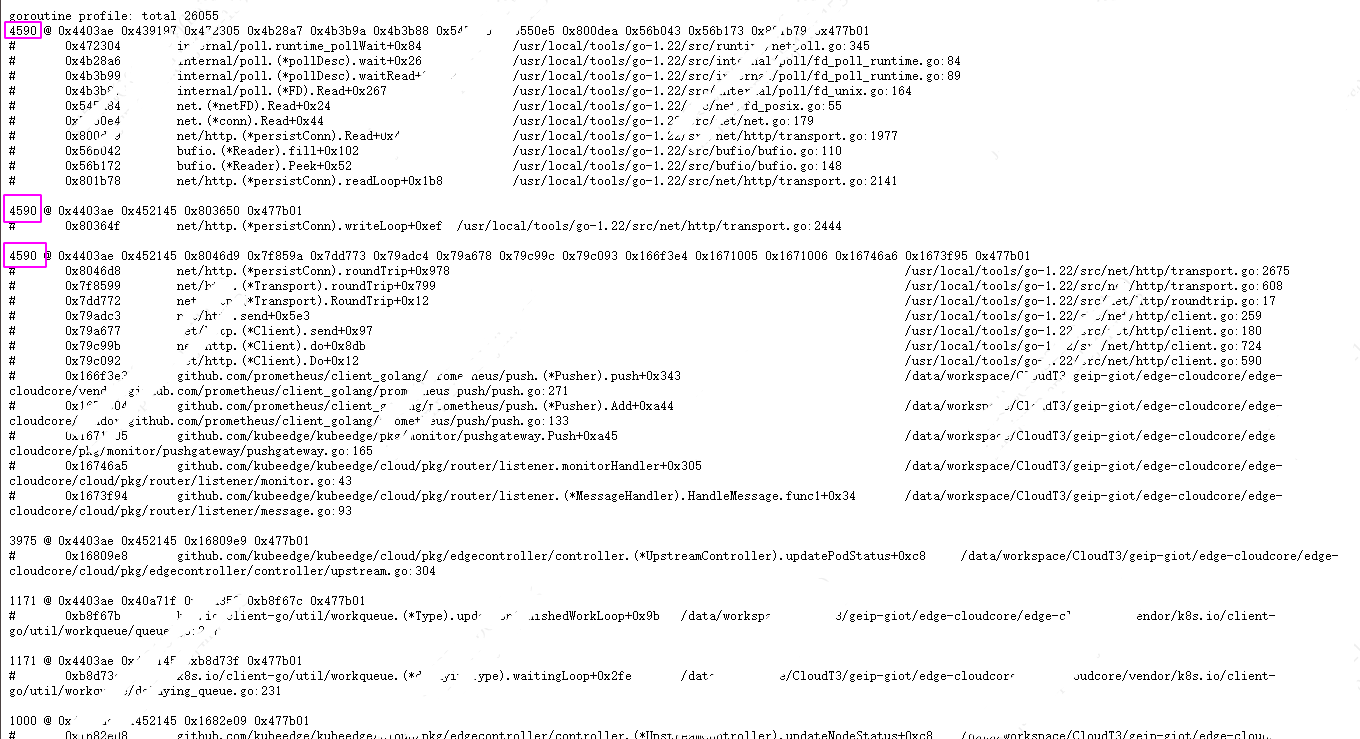
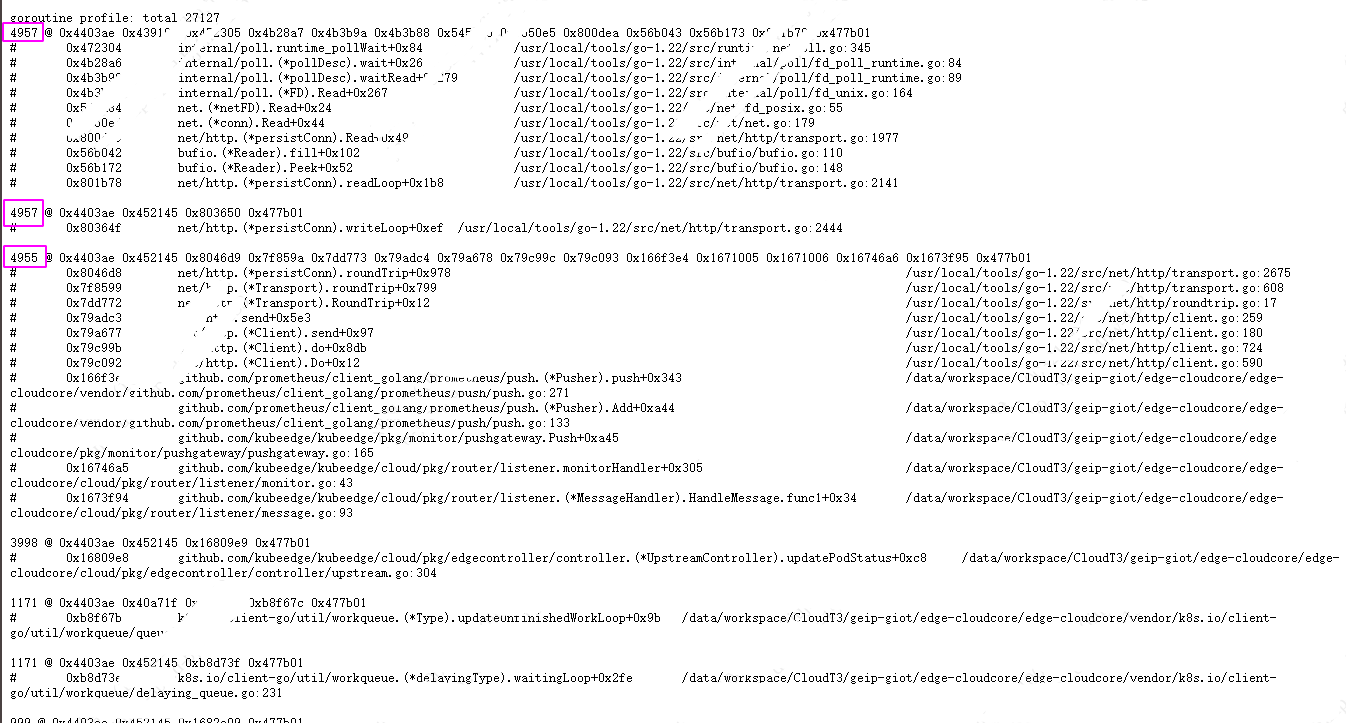
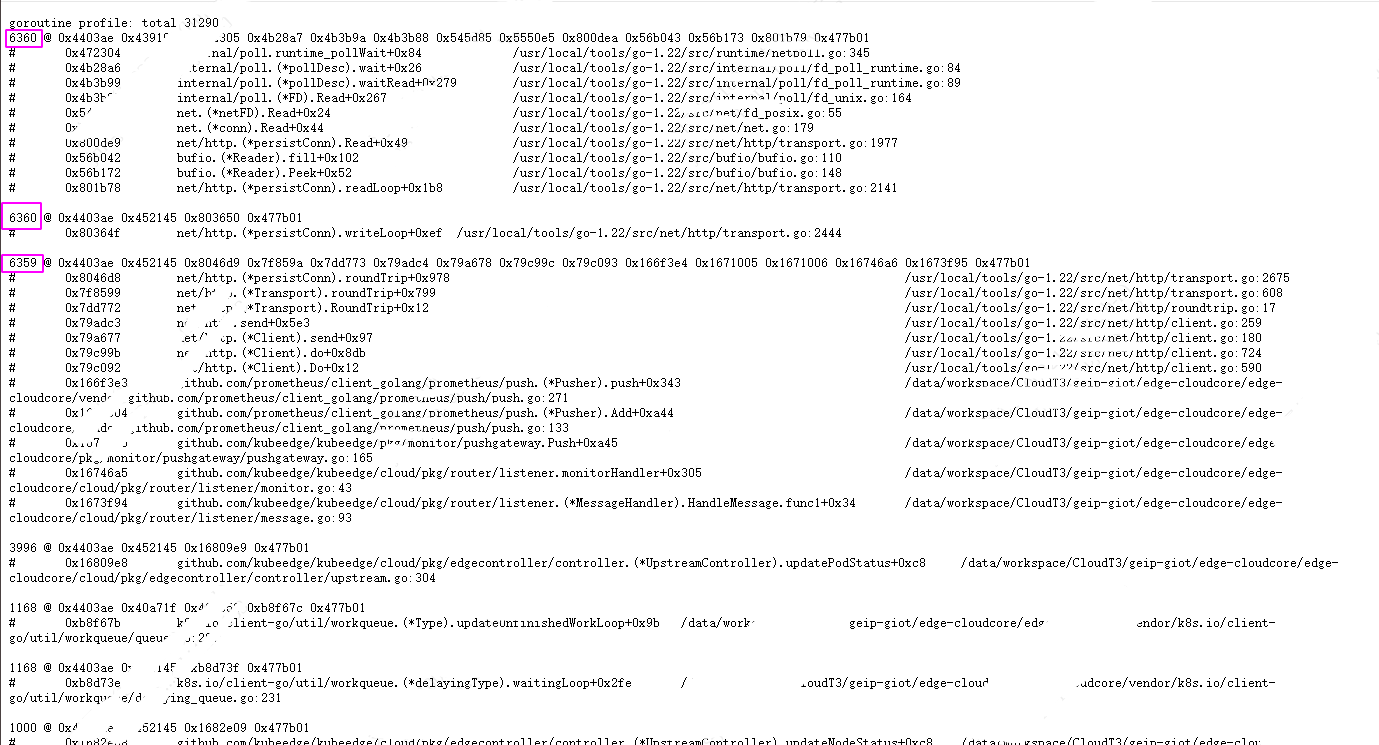
每间隔一段时间打开一个/debug/pprof/goroutine?debug=1 页面,最终四次结果的对比如下:
通过上图可以看到发生了网络超时问题,导致大量的 goroutine 阻塞。
 1
 2
 3
 4
 5
 6
 7
 8
 9
10
11
12
| # 0x8046d8 net/http.(*persistConn).roundTrip+0x978 /usr/local/tools/go-1.22/src/net/http/transport.go:2675
# 0x7f8599 net/http.(*Transport).roundTrip+0x799 /usr/local/tools/go-1.22/src/net/http/transport.go:608
# 0x7dd772 net/http.(*Transport).RoundTrip+0x12 /usr/local/tools/go-1.22/src/net/http/roundtrip.go:17
# 0x79adc3 net/http.send+0x5e3 /usr/local/tools/go-1.22/src/net/http/client.go:259
# 0x79a677 net/http.(*Client).send+0x97 /usr/local/tools/go-1.22/src/net/http/client.go:180
# 0x79c99b net/http.(*Client).do+0x8db /usr/local/tools/go-1.22/src/net/http/client.go:724
# 0x79c092 net/http.(*Client).Do+0x12 /usr/local/tools/go-1.22/src/net/http/client.go:590
# 0x166f3e3 github.com/prometheus/client_golang/prometheus/push.(*Pusher).push+0x343 /data/workspace/CloudT3/geip-giot/edge-cloudcore/edge-cloudcore/vendor/github.com/prometheus/client_golang/prometheus/push/push.go:271
# 0x1671004 github.com/prometheus/client_golang/prometheus/push.(*Pusher).Add+0xa44 /data/workspace/CloudT3/geip-giot/edge-cloudcore/edge-cloudcore/vendor/github.com/prometheus/client_golang/prometheus/push/push.go:133
# 0x1671005 github.com/kubeedge/kubeedge/pkg/monitor/pushgateway.Push+0xa45 /data/workspace/CloudT3/geip-giot/edge-cloudcore/edge-cloudcore/pkg/monitor/pushgateway/pushgateway.go:165
# 0x16746a5 github.com/kubeedge/kubeedge/cloud/pkg/router/listener.monitorHandler+0x305 /data/workspace/CloudT3/geip-giot/edge-cloudcore/edge-cloudcore/cloud/pkg/router/listener/monitor.go:43
# 0x1673f94 github.com/kubeedge/kubeedge/cloud/pkg/router/listener.(*MessageHandler).HandleMessage.func1+0x34 /data/workspace/CloudT3/geip-giot/edge-cloudcore/edge-cloudcore/cloud/pkg/router/listener/message.go:93
|
这一快的逻辑如下:
kubeedge 收到边缘发来的信息后,推送到pushgateway:
1
2
3
4
5
6
7
8
| MessageHandlerInstance.AddListener("bus/node/monitor", monitorHandler)
....
err = pushgateway.Push(nodeName, sysInfo)
pusher := push.New(gatewayUrl, node).Gatherer(registry)
pusher.Add(); // /monitor/pushgateway/pushgateway.go:165
|
这里的 pusher.Add() 对应的就是上面阻塞goroutine代码片段调用栈的最后一行业务逻辑代码。
在 cloudcore 的配置文件中:
1
| pushGateway: edge-pushgateway-svc:9091
|
所以数据推到了 pushgateway 。
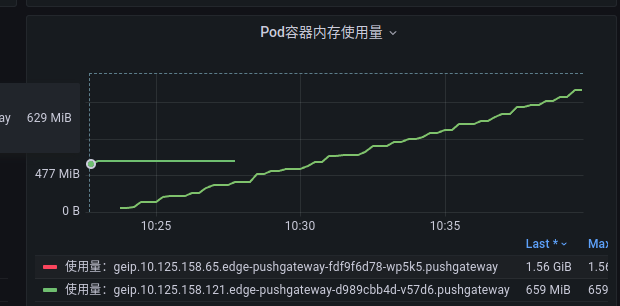
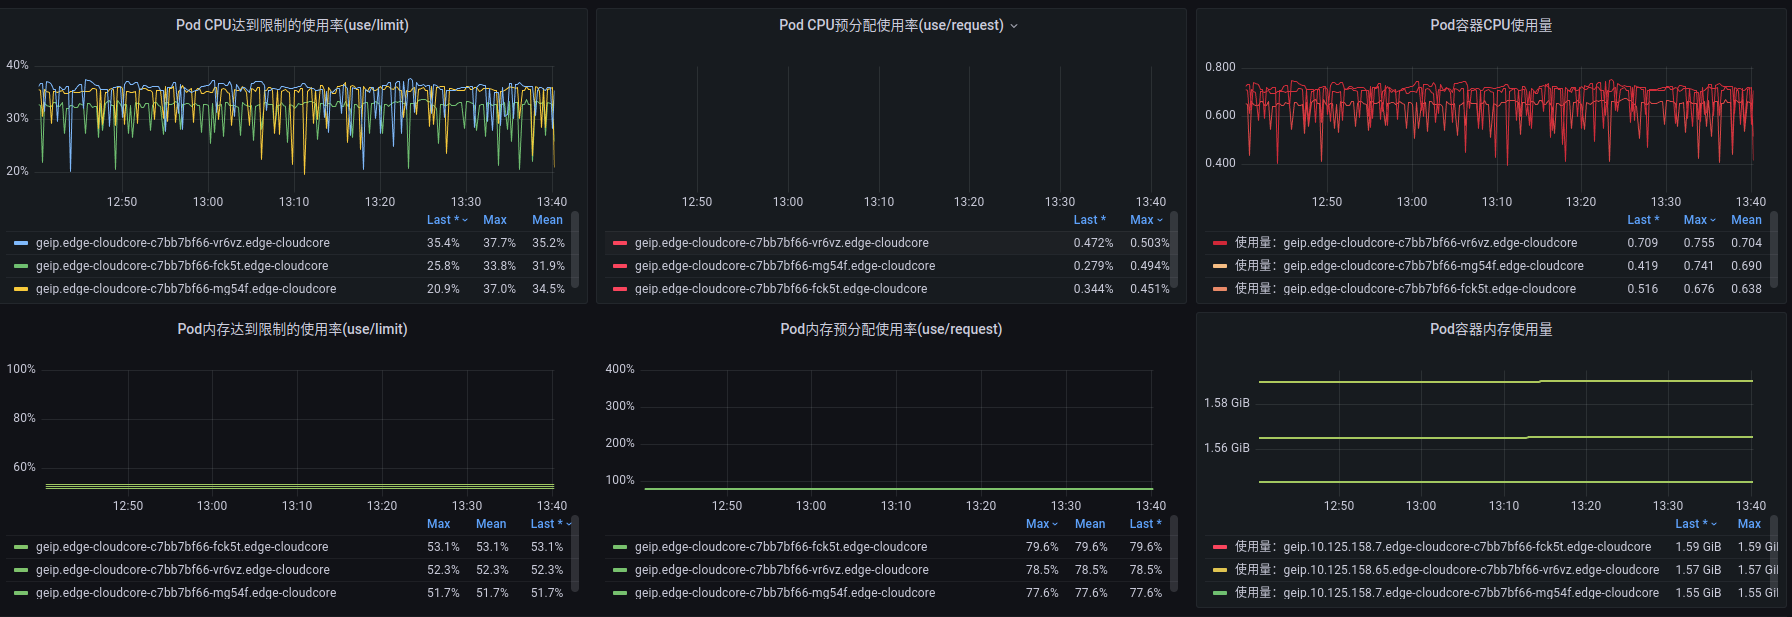
查看 pushgateway 的监控:
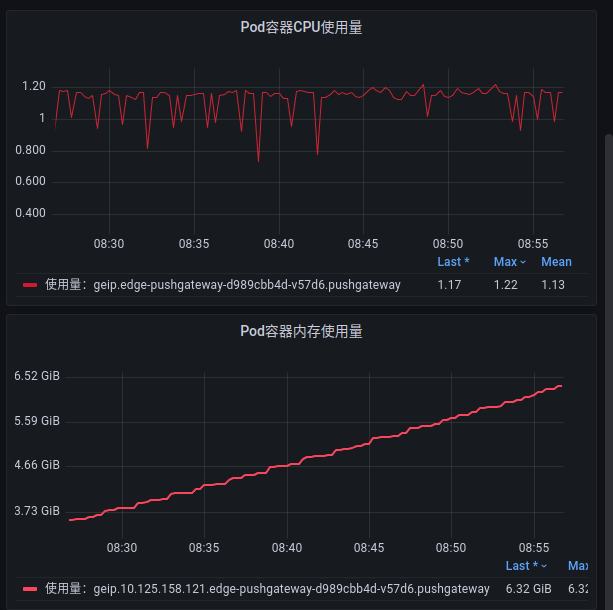
果然 pushgateway 的内存也非常高。
接着往下,就是等待 prometheus 来 pushgateway 拉数据:
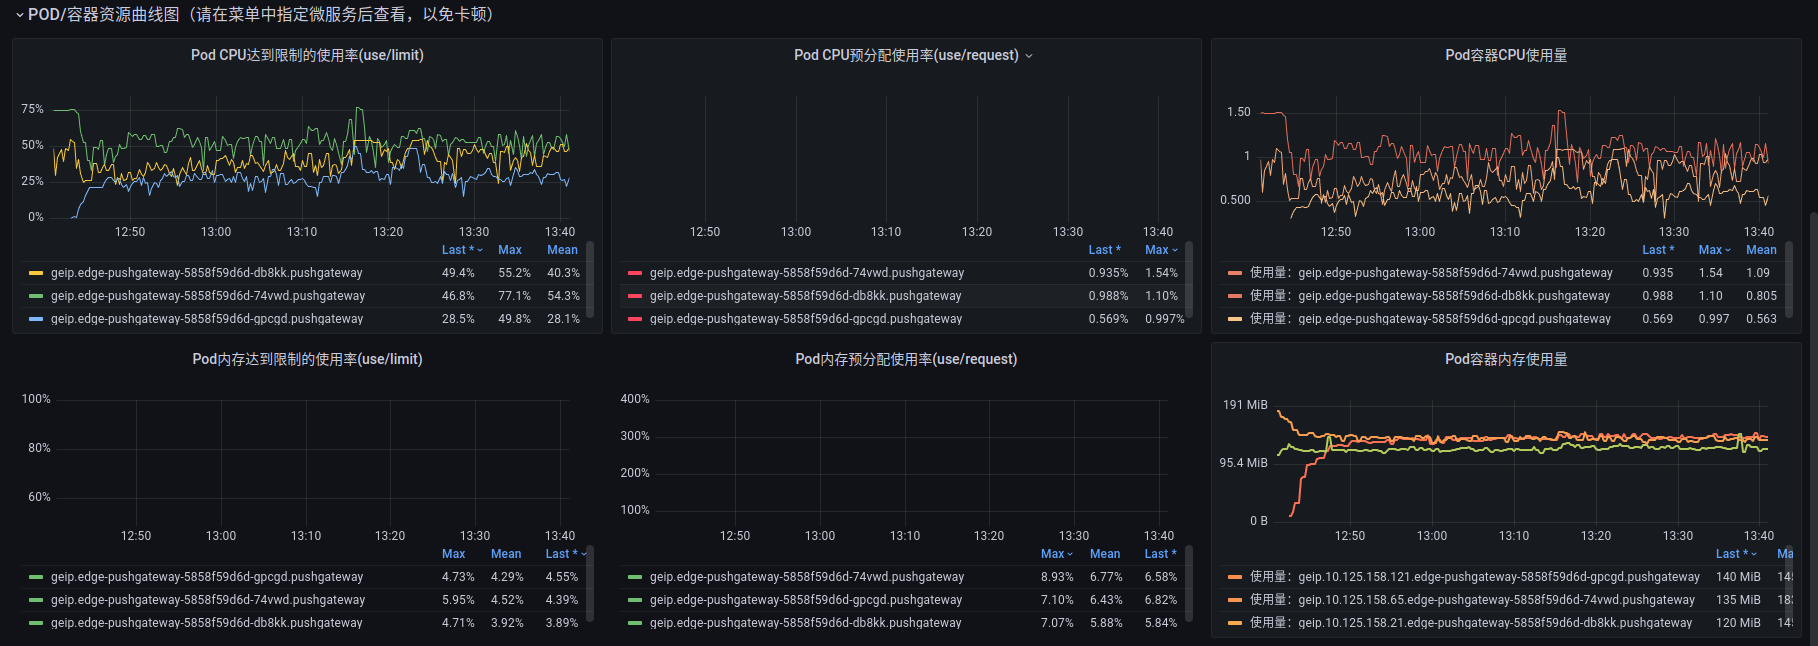
所以查看 prometheus 的监控:
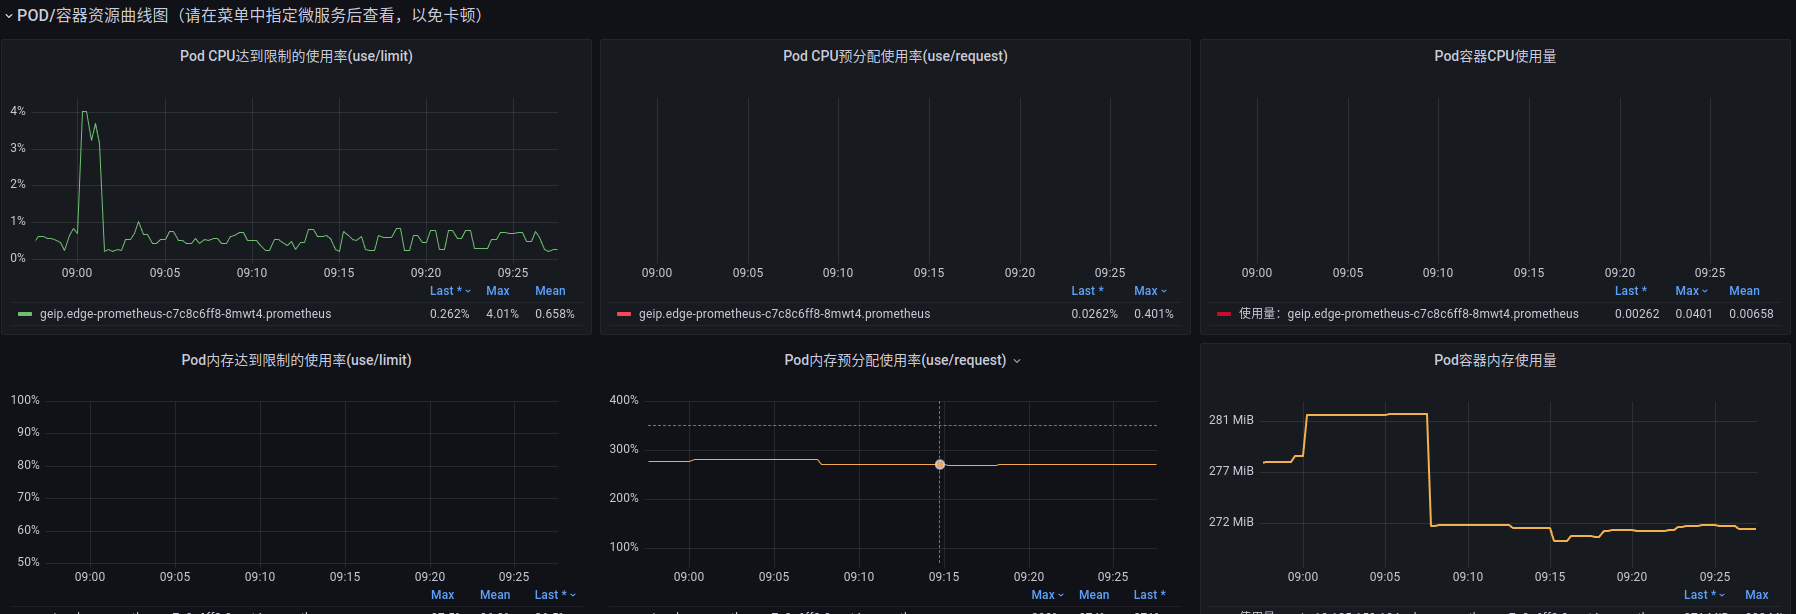
prometheus 的内存非常高。
所以现在整个问题的链路清楚了。接下来是分析解决问题。
2. 问题原因
既然 prometheus 长期非常高,而 pushgateway 内存一直涨,首先想到的就是 prometheus 拉取消息太慢了 出现了消费不均匀。
查看 prometheus 的deployment yaml配置:
1
2
3
4
5
6
7
| resources:
limits:
cpu: "1"
memory: 1Gi
requests:
cpu: 100m
memory: 100Mi
|
发现,内存配置确实太低了,cpu配置也不高。
再看 prometheus.yml
 1
 2
 3
 4
 5
 6
 7
 8
 9
10
| global:
scrape_interval: 60s
evaluation_interval: 60s
scrape_configs:
- job_name: 'pushgateway'
honor_labels: true
static_configs:
- targets: ['edge-pushgateway-svc:9091']
labels:
instance: pushgateway
|
每60s拉一次数据,整个有没有问题呢。
查看edgecore收集数据上报的逻辑:
1
2
| CollectionInterval = 60
t := time.NewTicker(time.Duration(CollectionInterval) * time.Second)
|
也就是说每个边缘节点每60s上报一次数据。目前线上有600个节点。
现在要确认的问题是 prometheus 每一次拉取多少数据,是一条? 还是一批?
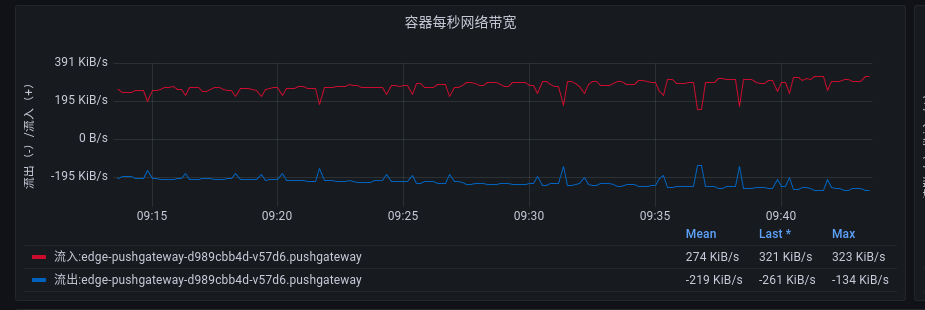
而且通过查看 prometheus 和 pushgateway 的pod网络监控也能发现,两个pod的流量是不均匀的:
pushgateway 网络 流入270KiB/s:
prometheus 网络 流入10KiB/s:
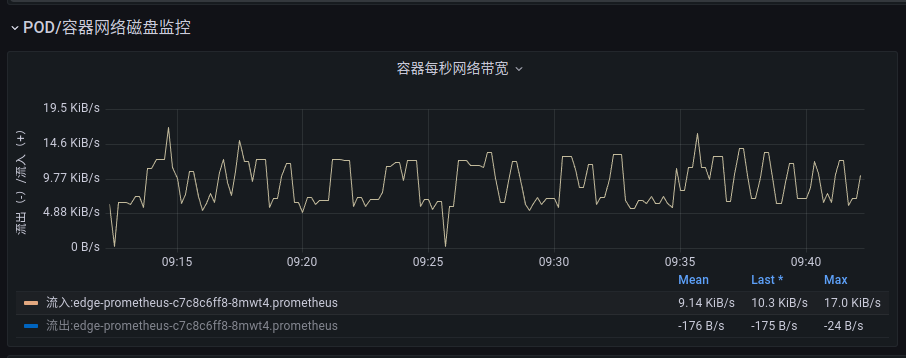
两边的流量是不均匀的。
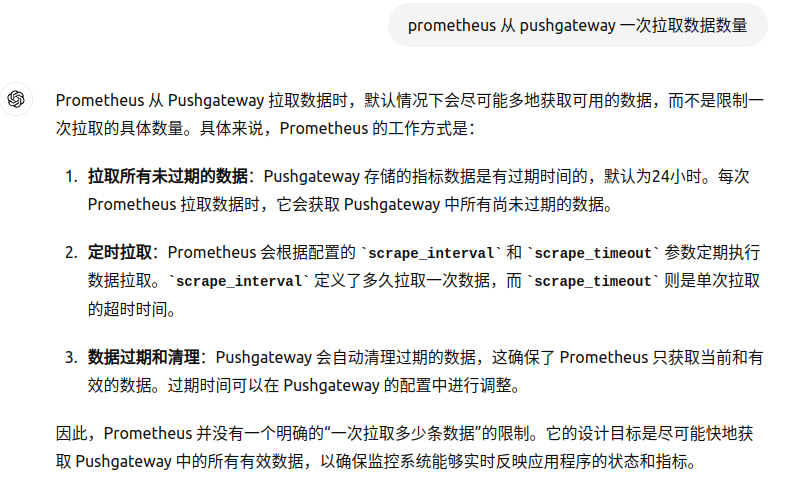
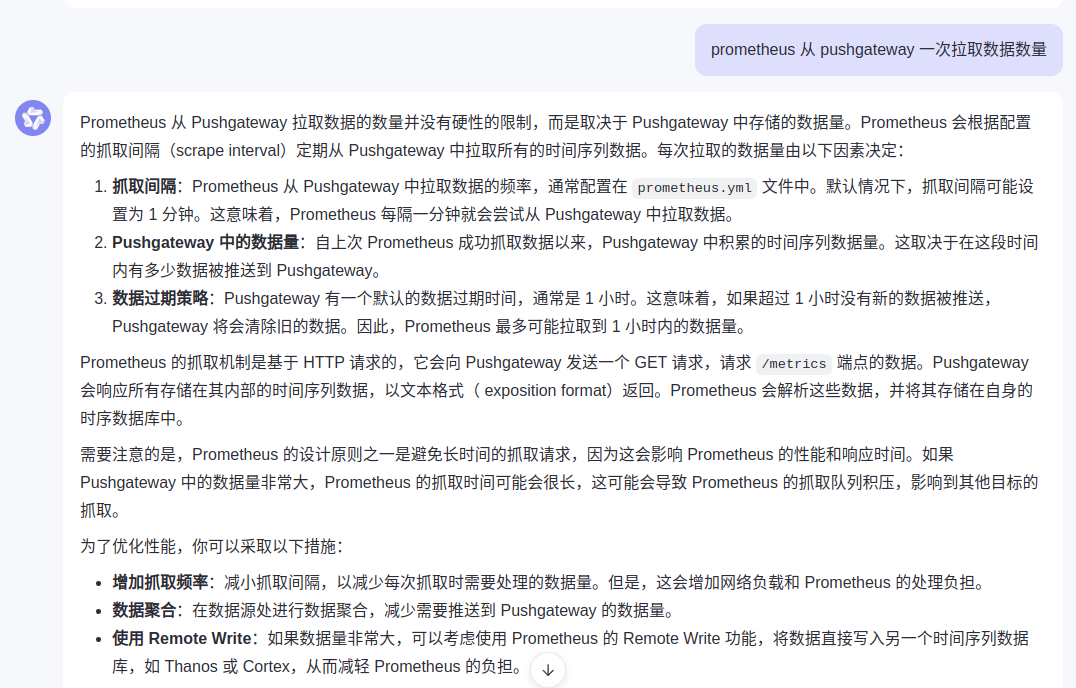
以上问题为了短平快,没有取深究源码,而是问了chatgpt和通义千问:
3. 原因解决
调整 1
缩短 prometheus 拉取间隔为2s:
 1
 2
 3
 4
 5
 6
 7
 8
 9
10
| global:
scrape_interval: 2s
evaluation_interval: 2s
scrape_configs:
- job_name: 'pushgateway'
honor_labels: true
static_configs:
- targets: ['edge-pushgateway-svc:9091']
labels:
instance: pushgateway
|
同时适当调整 prometheus pod资源为:
1
2
3
4
5
6
7
| resources:
limits:
cpu: "2"
memory: 2Gi
requests:
cpu: "1"
memory: 1Gi
|
优化后发现 pushgateway pod的内存还是在缓慢增长:
调整 2
缩短 prometheus 拉取间隔为1s.
更新 pushgateway:
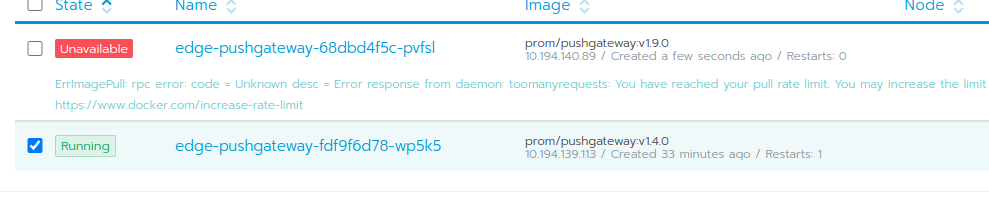 效果不明显。
调整 3
既然瓶颈在 pushgateway, 能否通过增加复本解决。这里有一个问题就是,prometheus 通过 k8s svc 与 pushgateway 通信,
是否会出现消费不均的行? 只能试一试:
目前来看,暂时稳住了。还需再继续观察。